The Debugger
Source-level debugging for Object Pascal, native to VS Code. Set a breakpoint, then inspect the running program directly from the Watch panel - call methods, read properties, and follow object and interface references. On 32-bit and 64-bit.
![VS Code debugging Object Pascal code with Vallenta Studio: Variables panel showing an object's [Properties] node, a Watch expression calling a method and returning a string, a set rendered as [fsBold, fsItalic], call stack and an active breakpoint.](/_next/image?url=%2Fvscode_debug.png&w=3840&q=75)
Inspection that goes beyond fields
Many debuggers show only an object's stored fields. Vallenta Studio resolves the full picture: it calls property getters, follows interface and class references, applies inheritance, and renders sets, enums and Booleans as they appear in source. Whatever you can read in code, you can read while the program is running - without adding logging or switching tools.
Live inspection, from the Watch panel
Call Methods from the Watch Panel
Enter a method call in the Watch panel and Vallenta Studio executes it on the live object - including methods that return a string or a Variant. Calls resolve against the variable's actual runtime type, so a same-named method on an unrelated class can't be invoked by mistake. The result is the value the program itself would return.
Read Properties - Including Inherited
Getter-backed properties resolve automatically - the debugger calls the getter and shows the result. Expand any object and they appear under a dedicated [Properties] node: numbers, strings, enums, sets, object references and Variant, including properties inherited from a base class or interface. When a derived class overrides a getter, you see the derived value, not the ancestor's.
Follow Interface & Class Chains
An interface reference resolves to the concrete object behind it, with its actual fields. Multi-step expressions resolve at every hop - Report.ShortName.Value - through both interface and class getters, however deep the chain runs, all from the Watch panel.
Values in Source Form
Sets, enums and Booleans display as they appear in source - [fsBold, fsItalic], fsBold, True / False - whether read directly or returned by a getter. Dynamic arrays show their length and elements (including primitive, pointer and nested array types) rather than a bare address, and Natvis visualizers render objects with their proper Pascal type names.
Helper Members & String Length
Call helper members on records, classes and simple types directly from the Watch panel - IntVal.Doubled on an Integer - and read .Length on any string kind (string, AnsiString, WideString, ShortString). When the linker has optimized a member away, a clear “not available” message appears instead of a cryptic type error.
Readable Exceptions, with Filters
When execution stops on an exception, you see the class and message - EConvertError: '12x' is not a valid integer value - instead of a raw 0x0EEDFADE code and parameter dump. The Exception Filters view skips the types you don't need to break on, by name or pattern (EAbort, E*); when stopped on one, a single action adds it to the list and continues.
See it in action
![Vallenta Studio Variables panel: an object showing its backing fields and an expanded [Properties] node with getter-backed properties resolved to values - a string, an enum, a set and an object reference.](/_next/image?url=%2Fvscode_debug_props.png&w=3840&q=75)
Getter-backed properties resolved under the [Properties] node - next to the raw fields that back them.
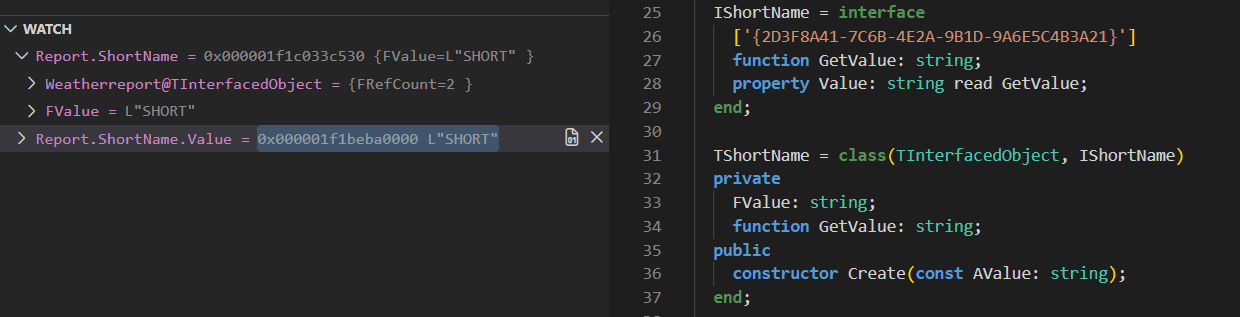
A multi-step expression resolved at every hop, through both interface and class getters.
![Vallenta Studio Variables panel rendering a set as [fsBold, fsItalic], an enum value, a Boolean True, and a dynamic array showing its length and elements.](/_next/image?url=%2Fvscode_debug_values.png&w=1920&q=75)
Sets, enums, Booleans and dynamic arrays shown the way they appear in source.
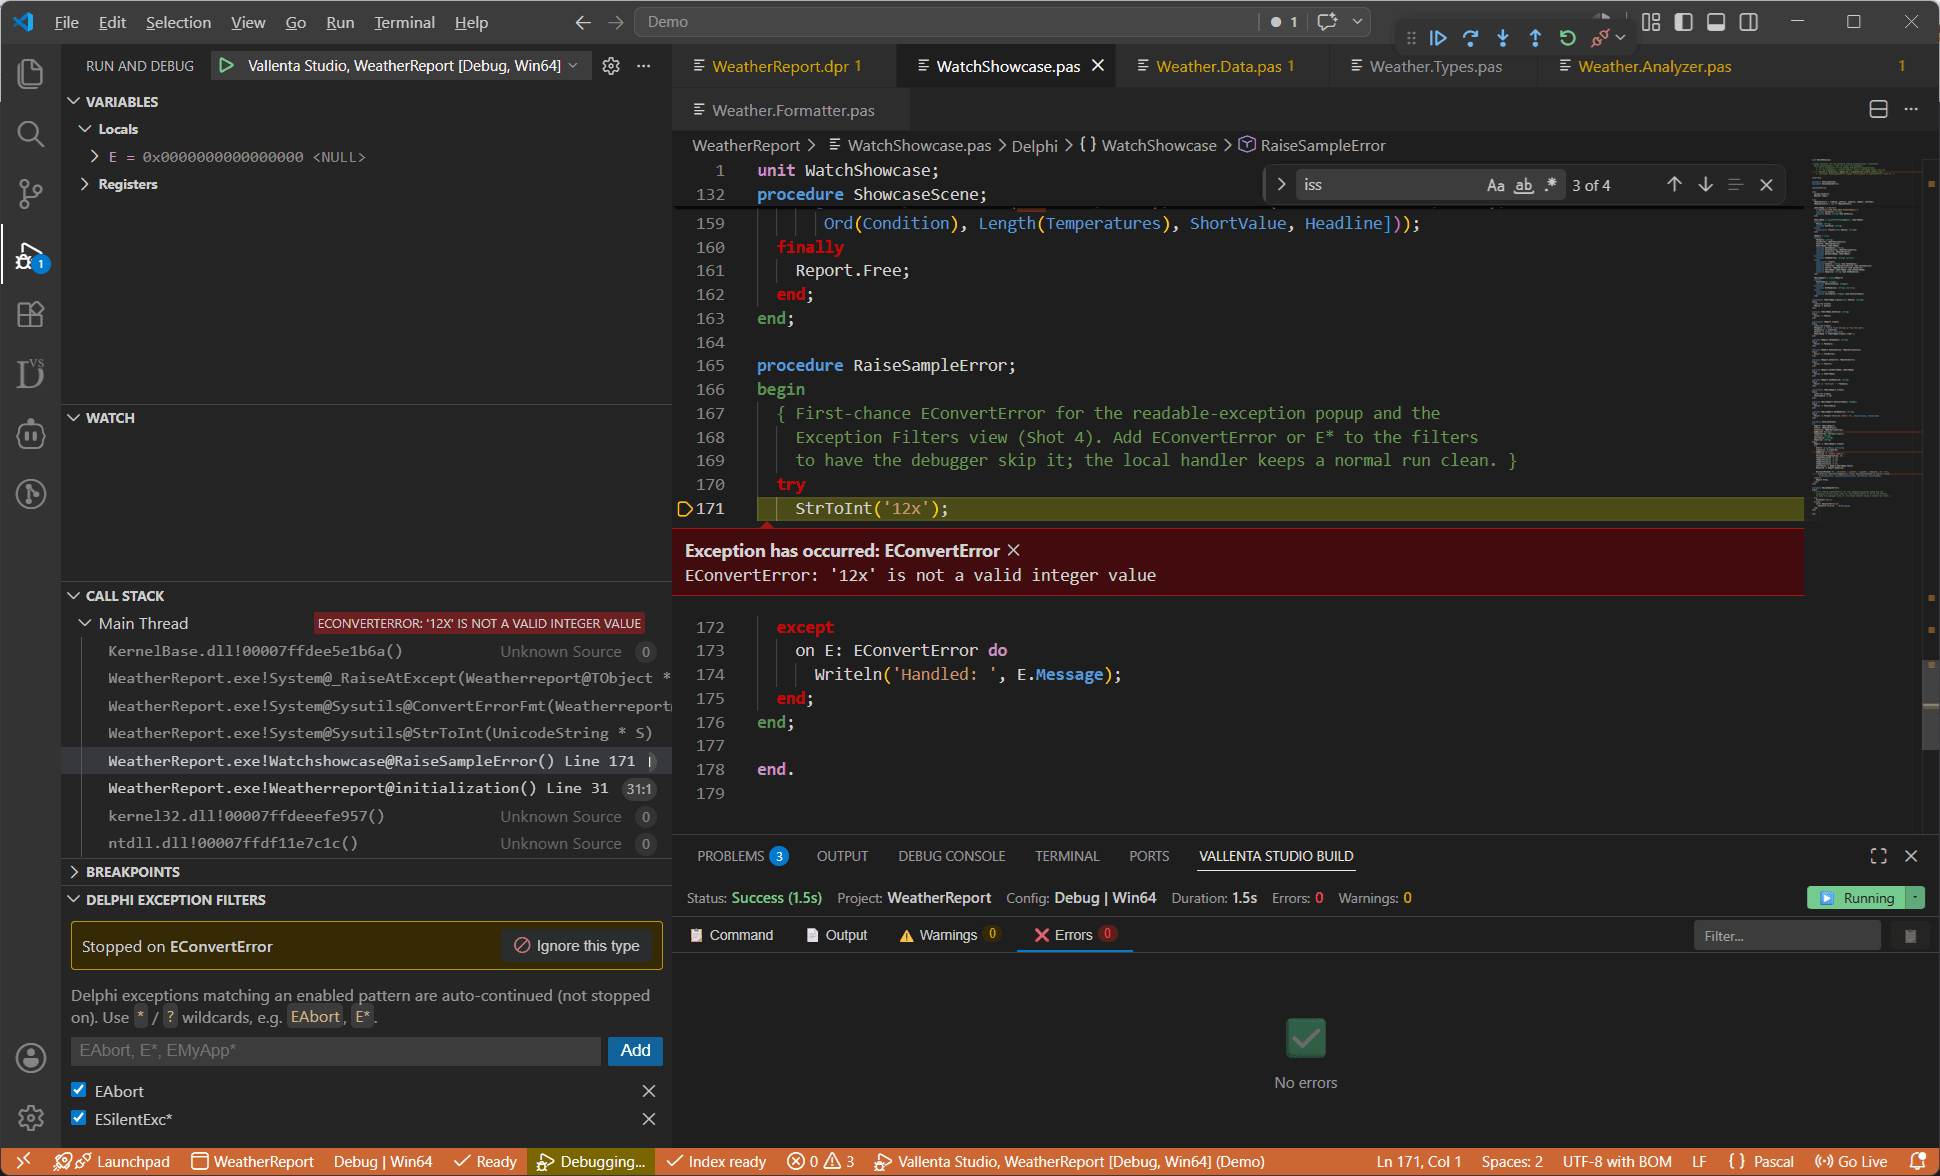
Choose which exception types the debugger skips - by name or pattern - so it doesn't stop on them.
How values are resolved
Reading a property or calling a method invokes the actual accessor on the actual object. Vallenta Studio resolves the correct routine through the object's runtime type, virtual method table and interface dispatch - the same path the program follows at execution time. That is why an overridden getter returns the overriding value, why a same-named method on an unrelated class is never called by mistake, and why a multi-step expression resolves exactly as the equivalent source would. Every capability on this page behaves identically on 32-bit and 64-bit targets.
Full source-level debugging, with Vallenta Studio Pro
Available on the Pro plan - try every Pro feature free for 5 days when you register.